
1- Definition of price action trading
2- Trading on “chaotic” and “clean” charts
3- Identification of trending and consolidating markets through price actions
4- How to Trade using Price Action Trading Strategies
5- Use of chart merge signals and price actions
Definition of Price Action Trading
Price Action Trading (PAT) is the discipline of making all your trading decisions based on a stripped-down or “bare” price chart. This means that there are no lagging indicators beyond perhaps a few moving averages to determine dynamic support and resistance areas and trends. All financial markets generate data on the movement of prices in the market for different periods of time; this data is displayed on price charts. Price charts reflect the beliefs and actions of all participants (people or computers) trading in the market for a certain period of time, and these beliefs are represented on the market price chart in the form of “price actions” (PA).
Although economic data and other global news events are catalysts for price movements in the market, we do not need to analyze them in order to trade successfully in the market. The reason is quite simple; all economic data and world news that cause price changes in the market are eventually reflected on the market price chart via PA.
Since the PA of the market reflects all the variables that affect this market over a certain period of time, using lagging price indicators such as stochastic, MACD, RSI and others is a waste of time. Price movement provides all the signals you will ever need to create a profitable trading system with a high degree of probability. These signals are collectively called price action trading strategies and provide a way to understand the price movement in the market and predict its future movement with high enough accuracy to give you a trading strategy with high probability.
“Clean” charts compared to “chaotic” charts loaded with indicators
I then demonstrated the two charts in the examples below to demonstrate the sharp contrast between the PA-only chart and the chart showing some of the most popular trading indicators. There are no indicators on the chart above, there is nothing on this chart except the raw PA of the market. The lower chart contains the MACD, Stochastic, ADX and Bollinger bands; the four most commonly used indicators, also known as “secondary” analytical tools, as they are sometimes called:
It’s worth noting that you actually need to free up some space on a chart loaded with indicators so that the indicators are at the bottom. This causes them to compress part of the PA chart, and also distracts their attention from the natural PA and to the indicators. Thus, not only do they have less screen space to view the PA, but their attention is not fully focused on the price action of the market, as it should be.
If you really look at both charts and think about which one is easier to analyze and trade, the answer should be pretty clear. All indicators on the chart below, and in fact almost all indicators, are derived from the base parameter.. In other words, all traders, by adding indicators to their charts, create more variables for themselves; they do not receive any information or forecast hints that have not yet been provided by market action at raw prices.
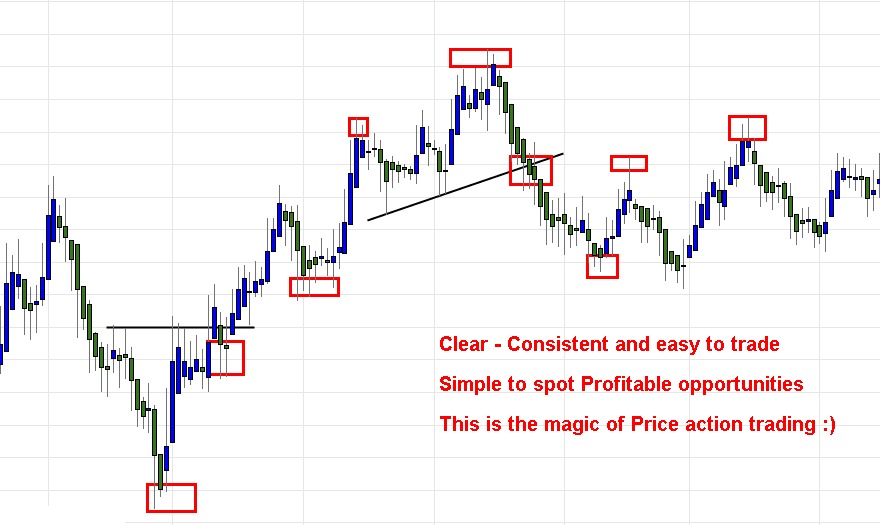
Examples of some of my favorite stock price trading strategies:
Next, we will look at some of the price action trading strategies that I taught. Please note that I have enabled the “failed” trade setting because not every trade will be a winning one; we are not here to show you “perfect” past trading results… we are here to teach you in an honest and realistic way.
Identify trends AGAINST. Consolidation of markets through price actions
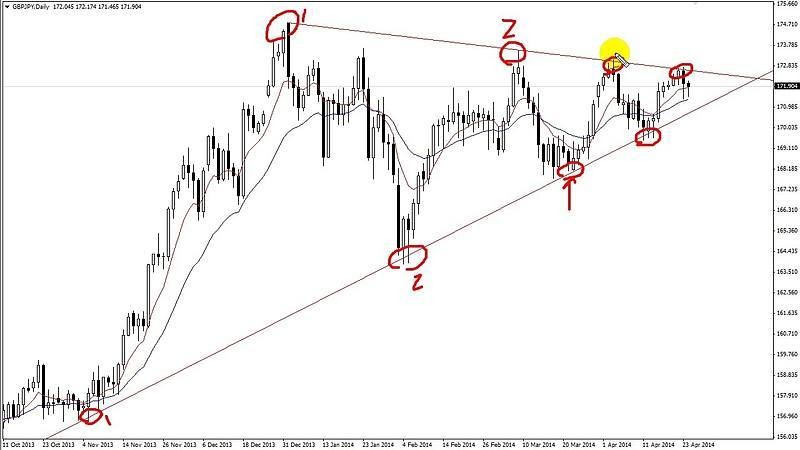
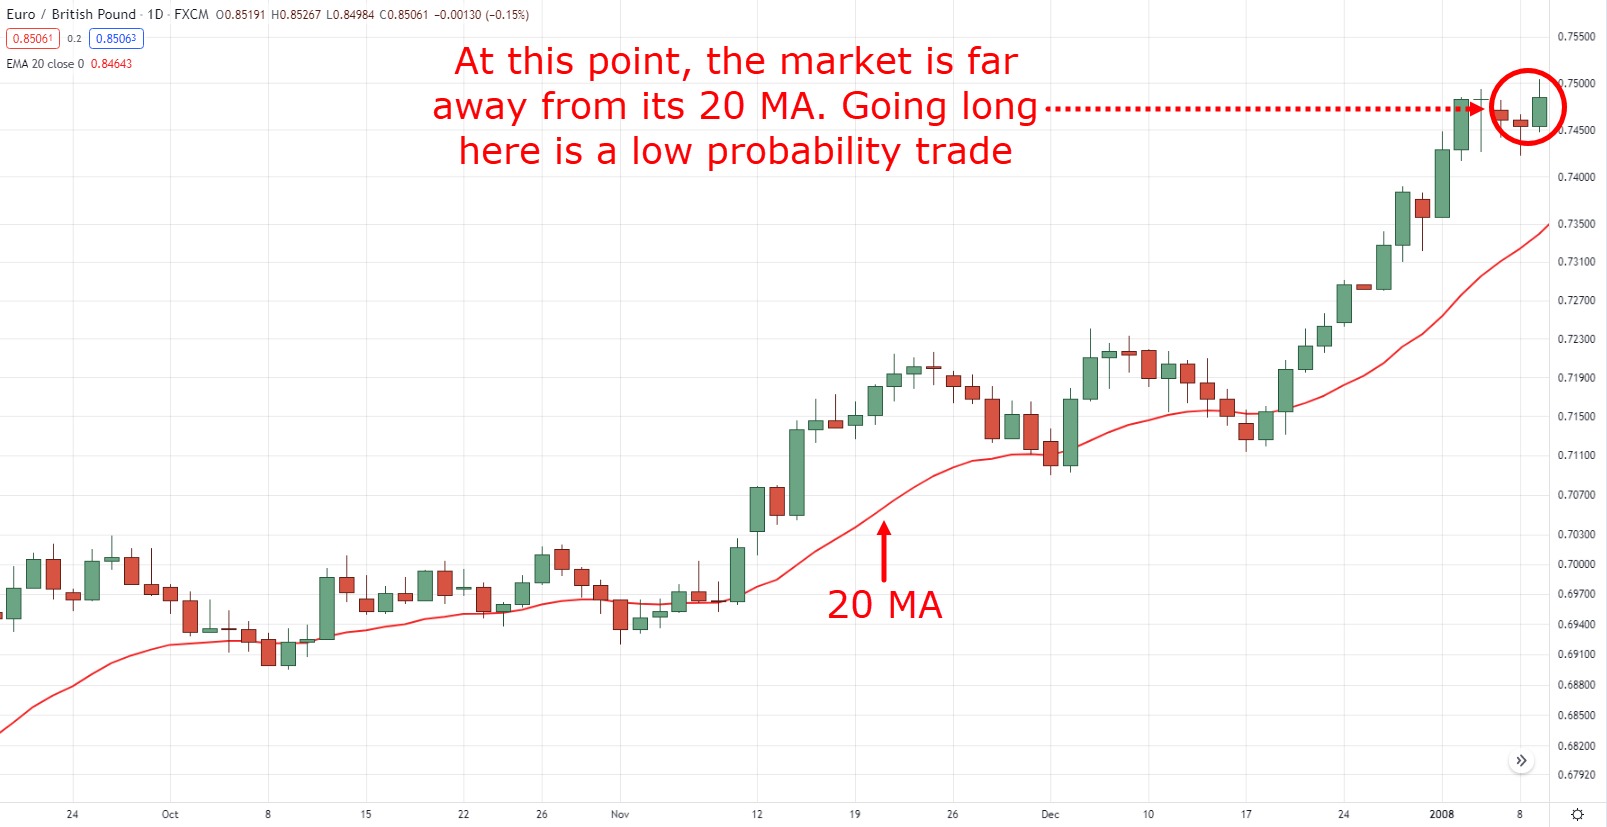
As we discussed earlier, PA, or “Price Action Trading Analysis”, is the analysis of price movement in the market over time. From our analysis of price movement, we can determine the main directional slope of the market or “trend”, or, if there is no trend in the market, it is called “consolidating”… we can easily determine whether the market is trending or consolidating by simply analyzing its PA.. Above we saw how to determine the market trend. To determine whether the market is consolidating, we simply look for the absence of HH, HL or LH, LL patterns. In the chart below, you can see how the “consolidating price action” moves between the horizontal support and resistance levels and instead of doing HH, HL or LH, LL, moves sideways instead…
How to Trade using Price Action Trading Strategies
So, how exactly do we trade price stocks? In fact, it all comes down to learning how to trade PA settings or patterns of merging levels in the market. Well, if this sounds new to you or confusing at the moment, stay calm and I’ll figure it out soon. First we need to sort out a few more things:
Due to the repetitive nature of market participants and how they react to global economic variables, market PA tends to repeat itself in different patterns. These patterns are also known as price action trading strategies, and there are many different price action strategies that are traded in different ways. These recurring pricing patterns or price action settings reflect changes or continuation of market sentiment. From the layman’s point of view, this simply means that recognizing price action patterns gives you “hints” as to where the price will move in the market next.
How to trade price actions from merge points in the market:
The next important step in PA trading is to build the main chart levels and search for merge levels from which to trade. On the chart below, we can see that a very obvious and smooth Pinbar setup has formed in USDJPY, which caused a huge upward trend. Please note that the pin bar trading setup showed a deviation from an impo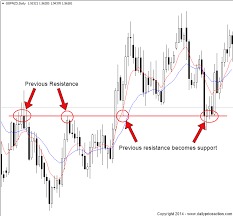 rtant horizontal support level, as well as a 50% tracking of the last major movement, so that the pin bar “merged” with the surrounding market structure…
Final Thoughts on Stock Price Trading…
I hope that today’s introduction to price action trading has been a useful and instructive lesson for you. No matter what strategy or system you end up using for trading, a clear understanding of PA will only make you a better trader. If you are like me and like simplicity and minimalism, you want to become a “pure” P.A. trader and remove all unnecessary variables from your charts